All Services

Analysis & Visualization

Publication-quality analysis tools for MD trajectories, docking results, and DFT outputs — RMSD, RMSF, SASA, Rg plots, free energy landscapes, DCCM, PCA, and binding site analysis.

What We Offer

Our analysis platform transforms raw simulation data into publication-ready figures and tables. The suite covers the full spectrum of computational biology analysis — from basic trajectory metrics to advanced statistical methods and 3D visualizations.

All tools generate matplotlib-based high-resolution plots exportable in PNG, PDF, and SVG formats. The modern PySide6 interfaces provide interactive controls for legend editing, color schemes, axis customization, and multi-dataset overlay.
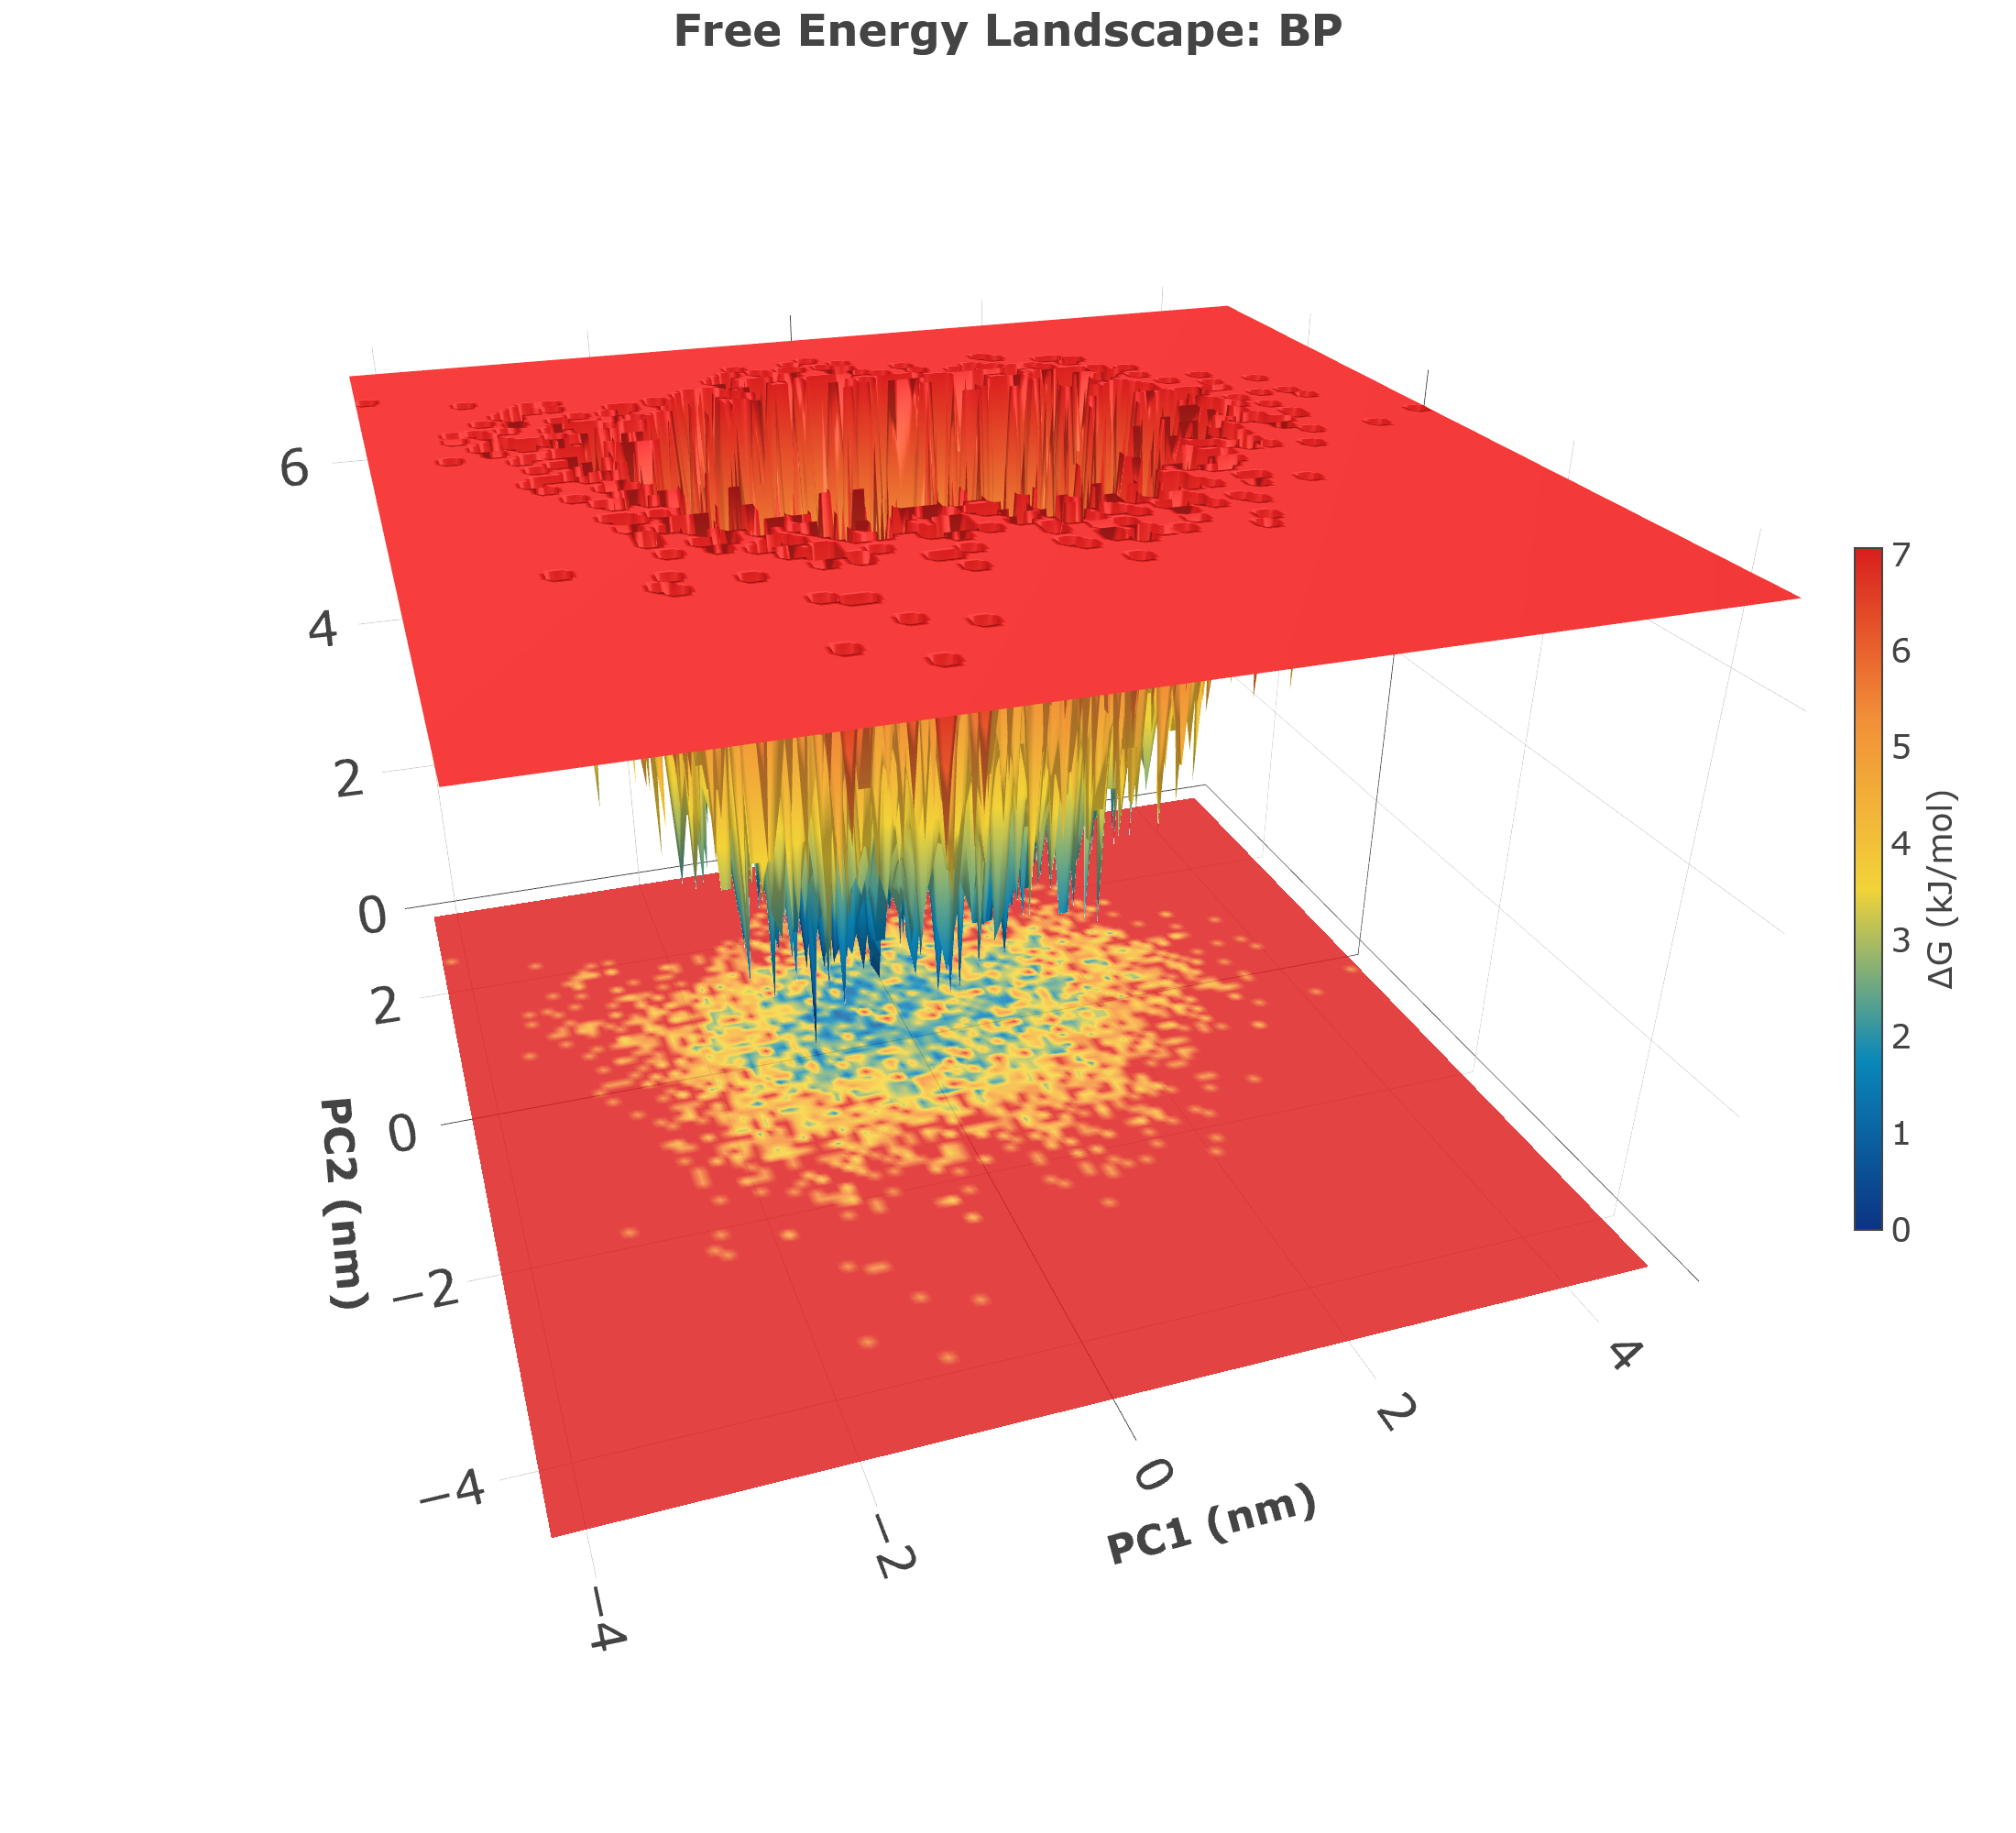

3D Free Energy Landscape

Analysis Types

Comprehensive analysis capabilities across all simulation workflows

RMSD

Root Mean Square Deviation — structural stability over time

RMSF

Root Mean Square Fluctuation — per-residue flexibility

SASA

Solvent Accessible Surface Area — solvent exposure

Rg

Radius of Gyration — compactness of protein structure

H-Bonds

Hydrogen bond analysis — intermolecular interactions

FEL 3D

Free Energy Landscape — conformational energy minima in 3D

DCCM

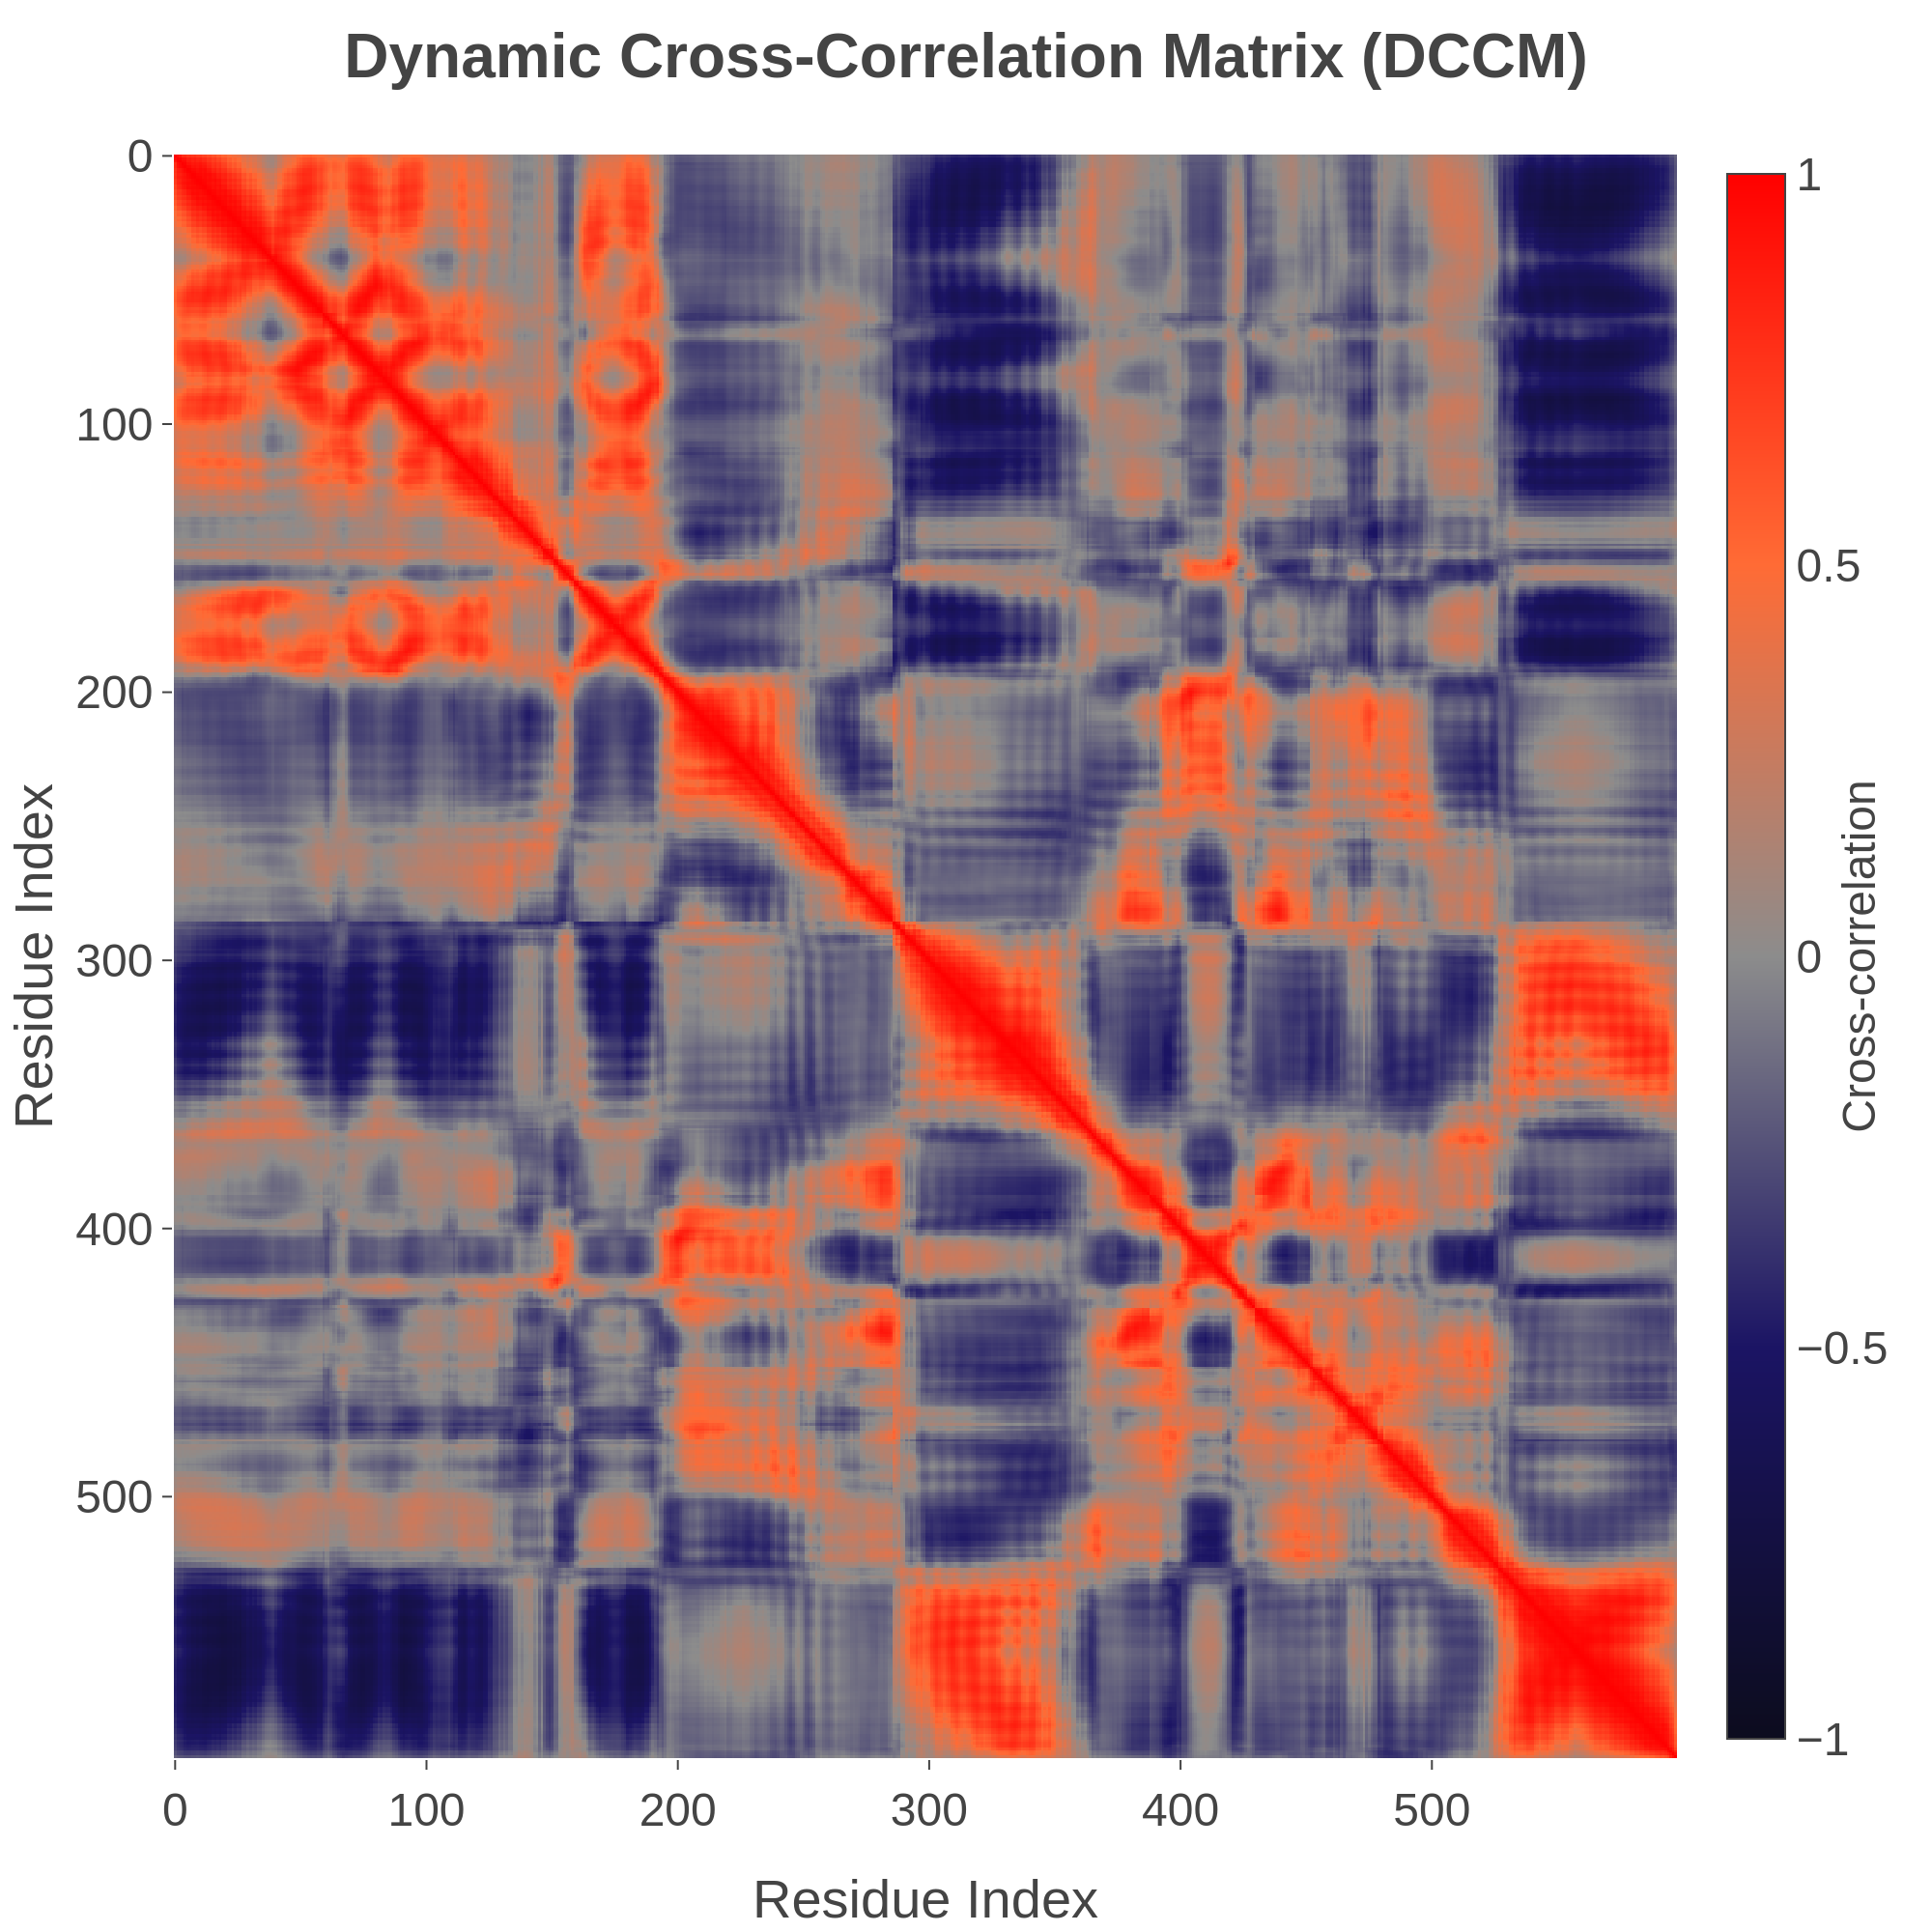
Dynamic Cross-Correlation Matrix — correlated motions

PCA

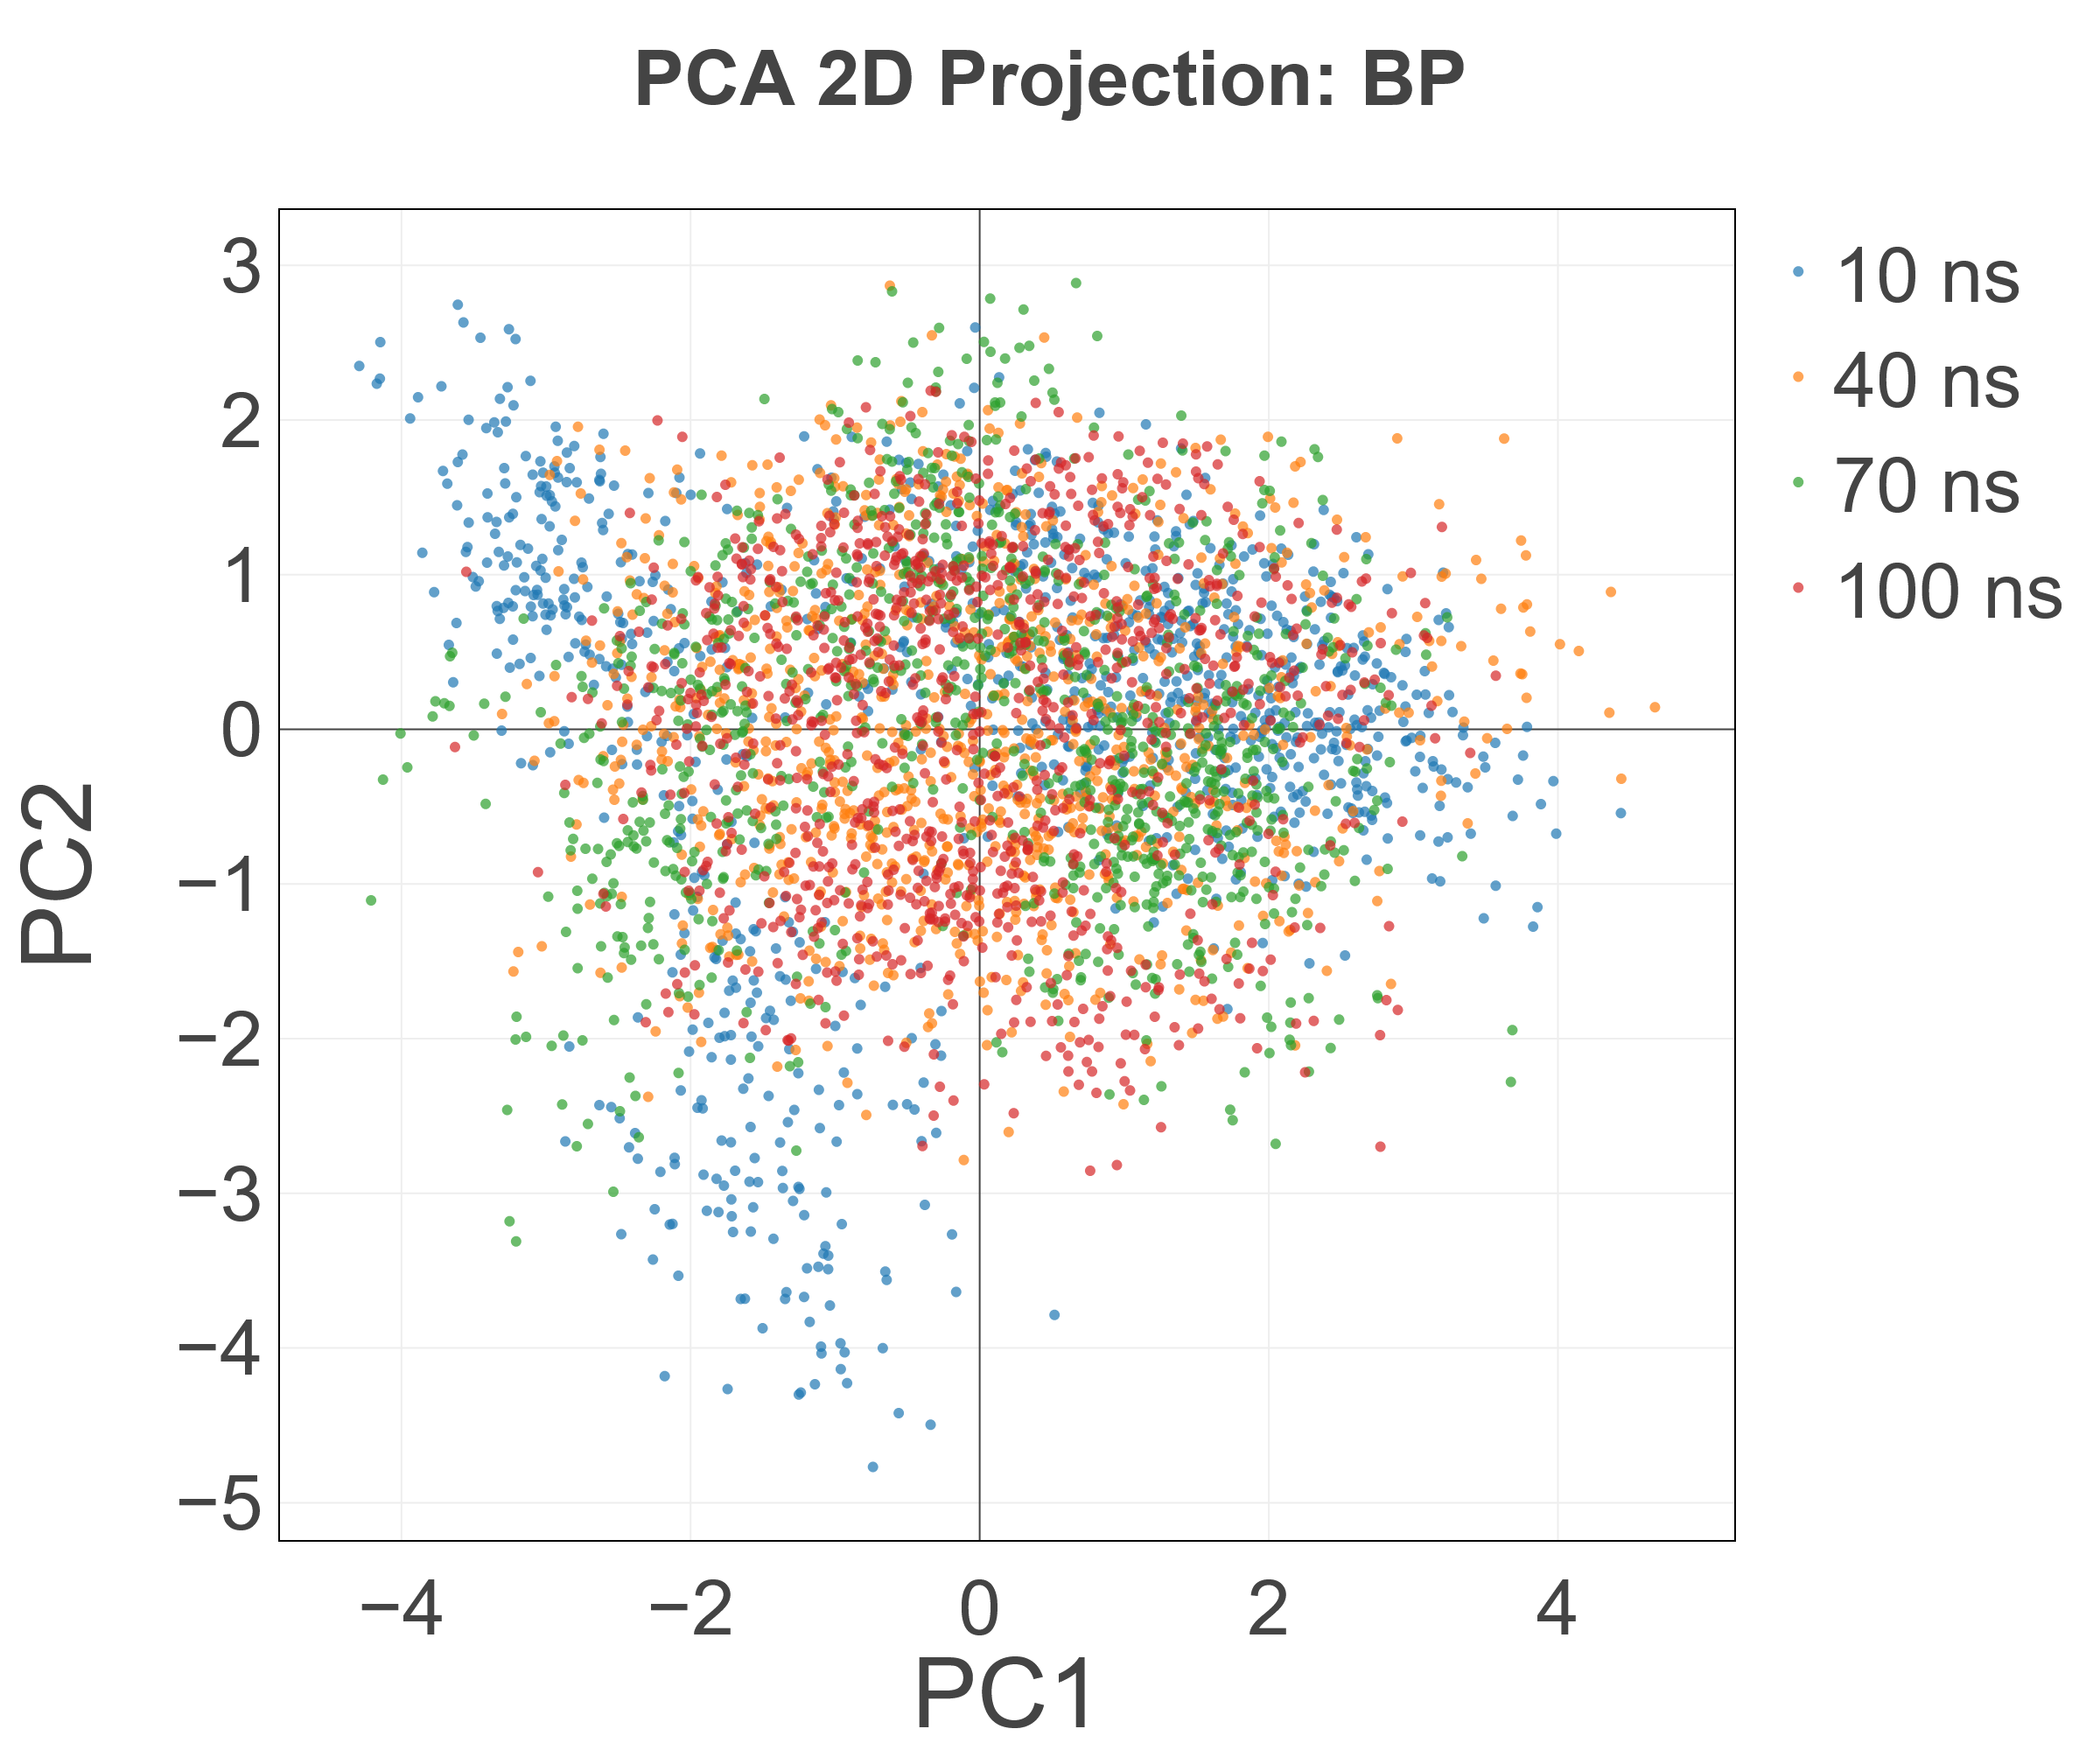
Principal Component Analysis — essential dynamics

Available Tools

Four integrated analysis modules in the web platform

MD Trajectory Analysis
  • Upload GROMACS XTC/TRR trajectories and run auto-analysis via the web interface
  • RMSD — Backbone structural deviation over simulation time
  • RMSF — Per-residue flexibility identifying loops and rigid domains
  • SASA / Rg / H-bonds — Solvent exposure, compactness, and hydrogen bond count plots
  • All plots exported as high-resolution PNG; multi-dataset overlay with legend control
MM-PBSA / MM-GBSA
  • Automated binding free energy calculation from GROMACS MD trajectories
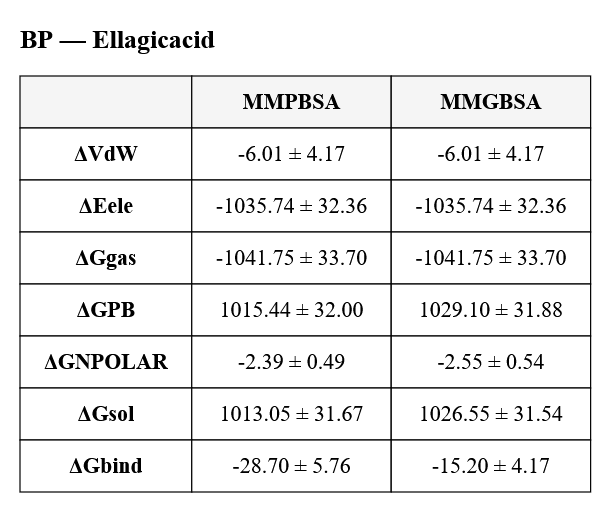
  • Full energy component table: ΔGvdW, ΔGelec, ΔGsolv, ΔGbind
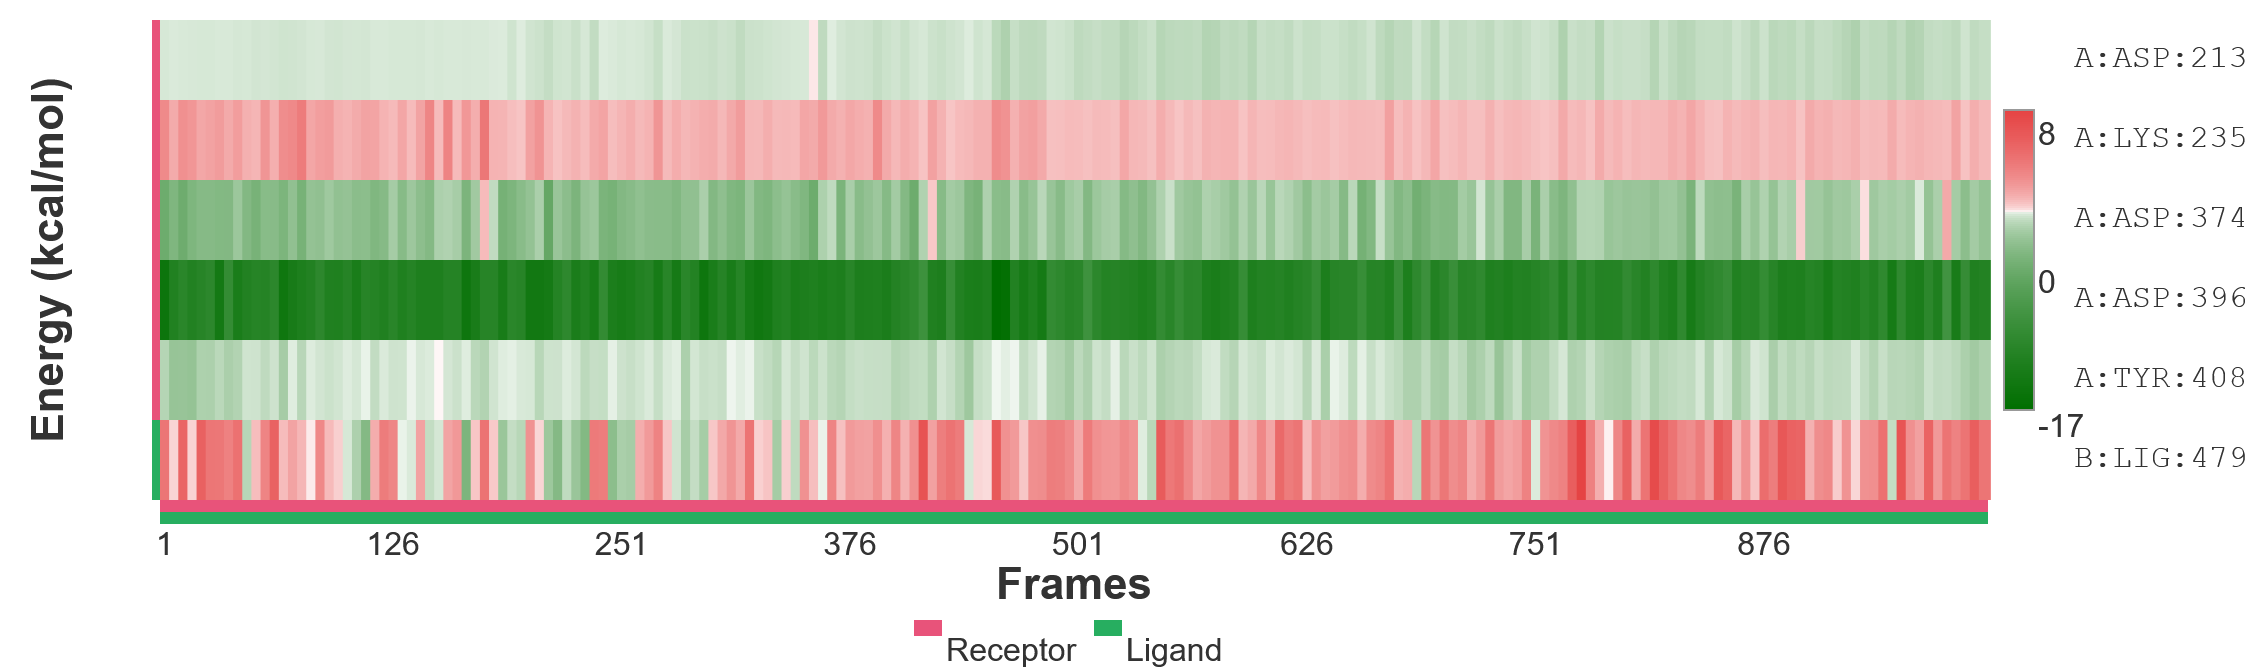
  • Per-residue energy decomposition heatmap identifying key binding residues
  • Publication-ready decomposition tables; CSV/Excel export
Advanced Landscape & Dynamics
  • FEL 3D — Free energy landscape surface with mesh, contour projection, and energy minima identification
  • DCCM — Dynamic cross-correlation matrix heatmap with customizable residue range and color scale
  • 2D PCA — Time-resolved PCA projections with free energy coloring and cluster identification
  • Binding Site PCA — Active-site-focused PCA revealing pocket conformational changes
Docking Result Analysis
  • Web-based docking result viewer: ranked binding energy table, SP vs XP comparison
  • Statistical plots: box plots, violin plots, 4-panel analysis across receptors and ligands
  • Interaction analysis: 2D DSV/spoke diagrams, interaction table, 3D complex viewer
  • Export results as CSV/Excel; download PDB complexes for further MD simulation

Output Gallery

Publication-ready outputs generated by the analysis platform

RMSD Trajectory Analysis
RMSD Analysis

Root Mean Square Deviation over simulation time — protein backbone stability assessment

3D Free Energy Landscape

FEL surface with mesh, contour projection, and energy minima showing conformational sampling

Dynamic Cross-Correlation Matrix
DCCM Heatmap

Residue-residue dynamic cross-correlation with customizable color scale

2D PCA Projection
2D PCA Projection

Time-resolved PCA scatter plot showing conformational sampling colored by free energy

MM-PBSA/GBSA Binding Free Energy Table
MM-PBSA/GBSA Table

Binding free energy components: ΔGvdW, ΔGelec, ΔGsolv, and total ΔGbind

MM-PBSA Energy Decomposition Heatmap
Energy Decomposition Heatmap

Per-residue MM-GBSA energy contributions — identifies key binding residues at a glance

Per-Residue RMSF Plot
RMSF — Per-Residue Flexibility

Root Mean Square Fluctuation per residue — identifies flexible loops and rigid domains

Video Demo

Watch a complete analysis workflow

Analysis & Visualization Demo

From raw trajectory data to publication-ready figures — Coming soon

Ready to Analyze Your Data?

Sign up to access the full suite of analysis and visualization tools

Get Started Contact Us